In-situ variability
ScanFish
Turbidity determines light climate and photosynthesis

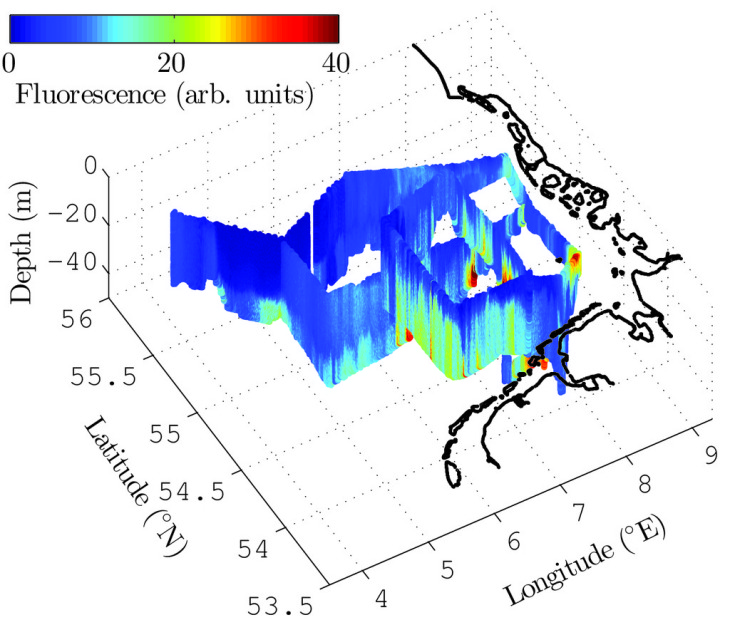
An example for a ScanFish cruise in the German Bight in May 2010: the spatial heterogeneity in turbity is well visible. (Graphics: Maerz/Hereon)
As part of the Coastal Observing System for Northern and Arctic Seas, physical and biological variables are measured in the German Bight. One powerful tool is the semi-automatic platform ScanFish on which several measurement units are installed. The ScanFish is towed behind research vessels (e.g. the FS Heincke or the Ludwig Prandtl) in an undulation flight mode, thus providing a fine-scale "curtain-like" twodimensional view into the water column.
Integrating model and data
To gain a process-based understanding of the North Sea ecosystem, we rely on and use data and their analyses in manifold ways.

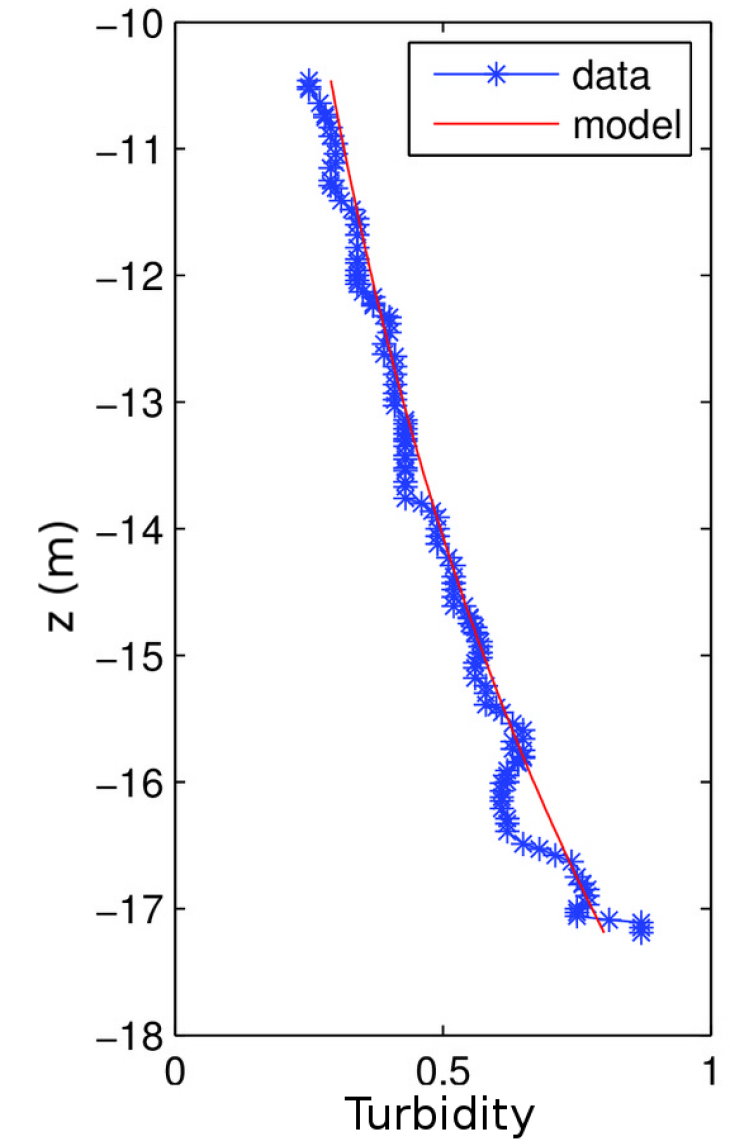
Exemplary turbidity profile taken with the ScanFish and a model fit to eventually retrieve sinking velocity. (Graphics: Maerz/Hereon)
First, data analyses provides measures to validate our models such as MAECS and verify their goodness to represent spatio-temporal pattern and variability. Data analysis thus helps to refine our models.
Second, we attempt to gain further knowledge of the underlying processes and their rates shaping the observed patterns. In particular, we presently combine state-of-the-art hydrodynamical model results with observables to gain insights into sinking velocities of suspended particulate matter (SPM), the major responsible for turbidity in coastal systems such as the German Bight.
Related publication: Maerz, J. et al. in prep: Evidence for a maximum of sinking velocities of suspended particulate matter in a coastal transition zone.
